THE HIGHESTSTANDARD OF LIVING
An empirical analysis of daily purchasing power, home sizing, residential comfort, and medical outcomes that define the American middle class.
Key indicators of American household wealth, space, utilities, and tax structures
Average Home Size
The average floor space per person in the US is more than double or triple that of major European nations (like Germany or the UK) and Japan.
Affordable Real Estate
America ranks second globally in housing affordability relative to average income, offering far more square footage per dollar than Europe.
30-Year Fixed Mortgage
The US is the only country where the 30-year fixed-rate mortgage is standard (~90% of buyers), shielding homeowners from interest rate shocks.
OECD Salaries (PPP)
Adjusted for purchasing power parity (PPP), the average American wage is the second highest in the OECD, behind only Switzerland.
Lowest Grocery Spend Share
Food is so affordable in America that households spend the smallest percentage of their budget on food globally, with guaranteed caloric scale.
Cheap Energy & Utilities
Low electricity and fuel prices relative to average wages make passenger cars and central air conditioning standard, not premium luxuries.
Highly Progressive Tax
The US operates the most progressive tax system in the G7. There is no regressive national sales tax (VAT); the top 1% bear the largest share.
Retail Space Density
The US has 2.3 square meters of retail space per person, compared to an average of just 0.4 square meters in Europe, offering immense convenience.
Democratized Luxury & Daily Utility
Standard home appliances and transport density that simplify daily life.
Air Conditioning (AC) Ubiquity
Data →Approximately 90% of US homes have air conditioning, ensuring comfort in hot summers. In contrast, only 10% to 20% of European homes have AC.
Home Appliances & Convenience
Data →Double-door massive refrigerators, built-in dishwashers, in-sink garbage disposals, and in-unit washing/drying machines are baseline standard features.
Vehicle Density & Auto Mobility
Data →With over 800 vehicles per 1,000 residents, low fuel costs, and a massive highway network, Americans enjoy unmatched personal mobility.
General Aviation & Private Skies
Data →The US general aviation fleet has over 220,000 active aircraft — representing 42% of the global fleet, dwarfing other major nations.
Cold Chain & Food Logistics
Data →A continuous refrigeration network spanning trucks and supermarkets preserves fresh food year-round, keeping costs down.
Self-Storage Facility Density
Data →The US holds 90% of the world's self-storage inventory, with over 50,000 facilities — more than McDonald's, Starbucks, and Subway combined.
Recreational Boat Ownership
Data →The US leads globally in recreational boating, with roughly 17 million boats and yachts owned by 15 million households.
The Public Library System
Data →The US operates over 17,000 public library outlets — more than the number of McDonald's locations globally. Free to any resident with a library card, these institutions lend over 1.3 billion items annually.
10.7 Million Swimming Pools: Democratized Luxury
Data →There are approximately 10.7 million swimming pools in the United States (10.4M residential, 309k public). A private in-ground pool — a luxury item in any other country — is a standard middle-class feature across the Sunbelt. Florida has 1.59 million residential pools (1 for every 14 residents) and Arizona has 1 for every 13 residents, dwarfing Germany (1.5M) and France (3.2M) relative to their populations.
Volunteer Firefighters: 750,000 Safe Neighbors
Data →The US operates the largest volunteer fire service globally with 750,000 volunteer firefighters serving in 27,000 departments (65% of the US fire service). These citizens receive no salary, train on their own time, and respond to emergencies, saving taxpayers over $46 billion annually. It represents civil society performing critical government functions through voluntary association.
The Pet Economy: $150 Billion Animal Companionship
Data →Total US pet industry sales reached $150.6 billion in 2024, representing 40% of the global market. Americans spend more on their pets annually than the entire GDP of dozens of sovereign nations. Advanced veterinary medicine (MRIs, oncologists, cardiologists for animals) represents a standard-of-living data point unique to the US.
The Home Improvement Market: Upgrading the Asset
Data →Valued at $534.57 billion in 2024, the US home improvement market is a product of single-family homeownership. Giganities Home Depot ($140B+ in revenue) and Lowe's ($85B+) serve homeowners continuously upgrading and investing in their private properties, an industry the size of a major nation's GDP generated by private individuals.


Food Abundance
Low-cost, high-velocity calories accessible on every corner.

Diner Dining
The informal community hub for middle-class casual dining.

Democratic Fashion
Levi's blue jeans and sneakers: the global uniform of classless comfort.

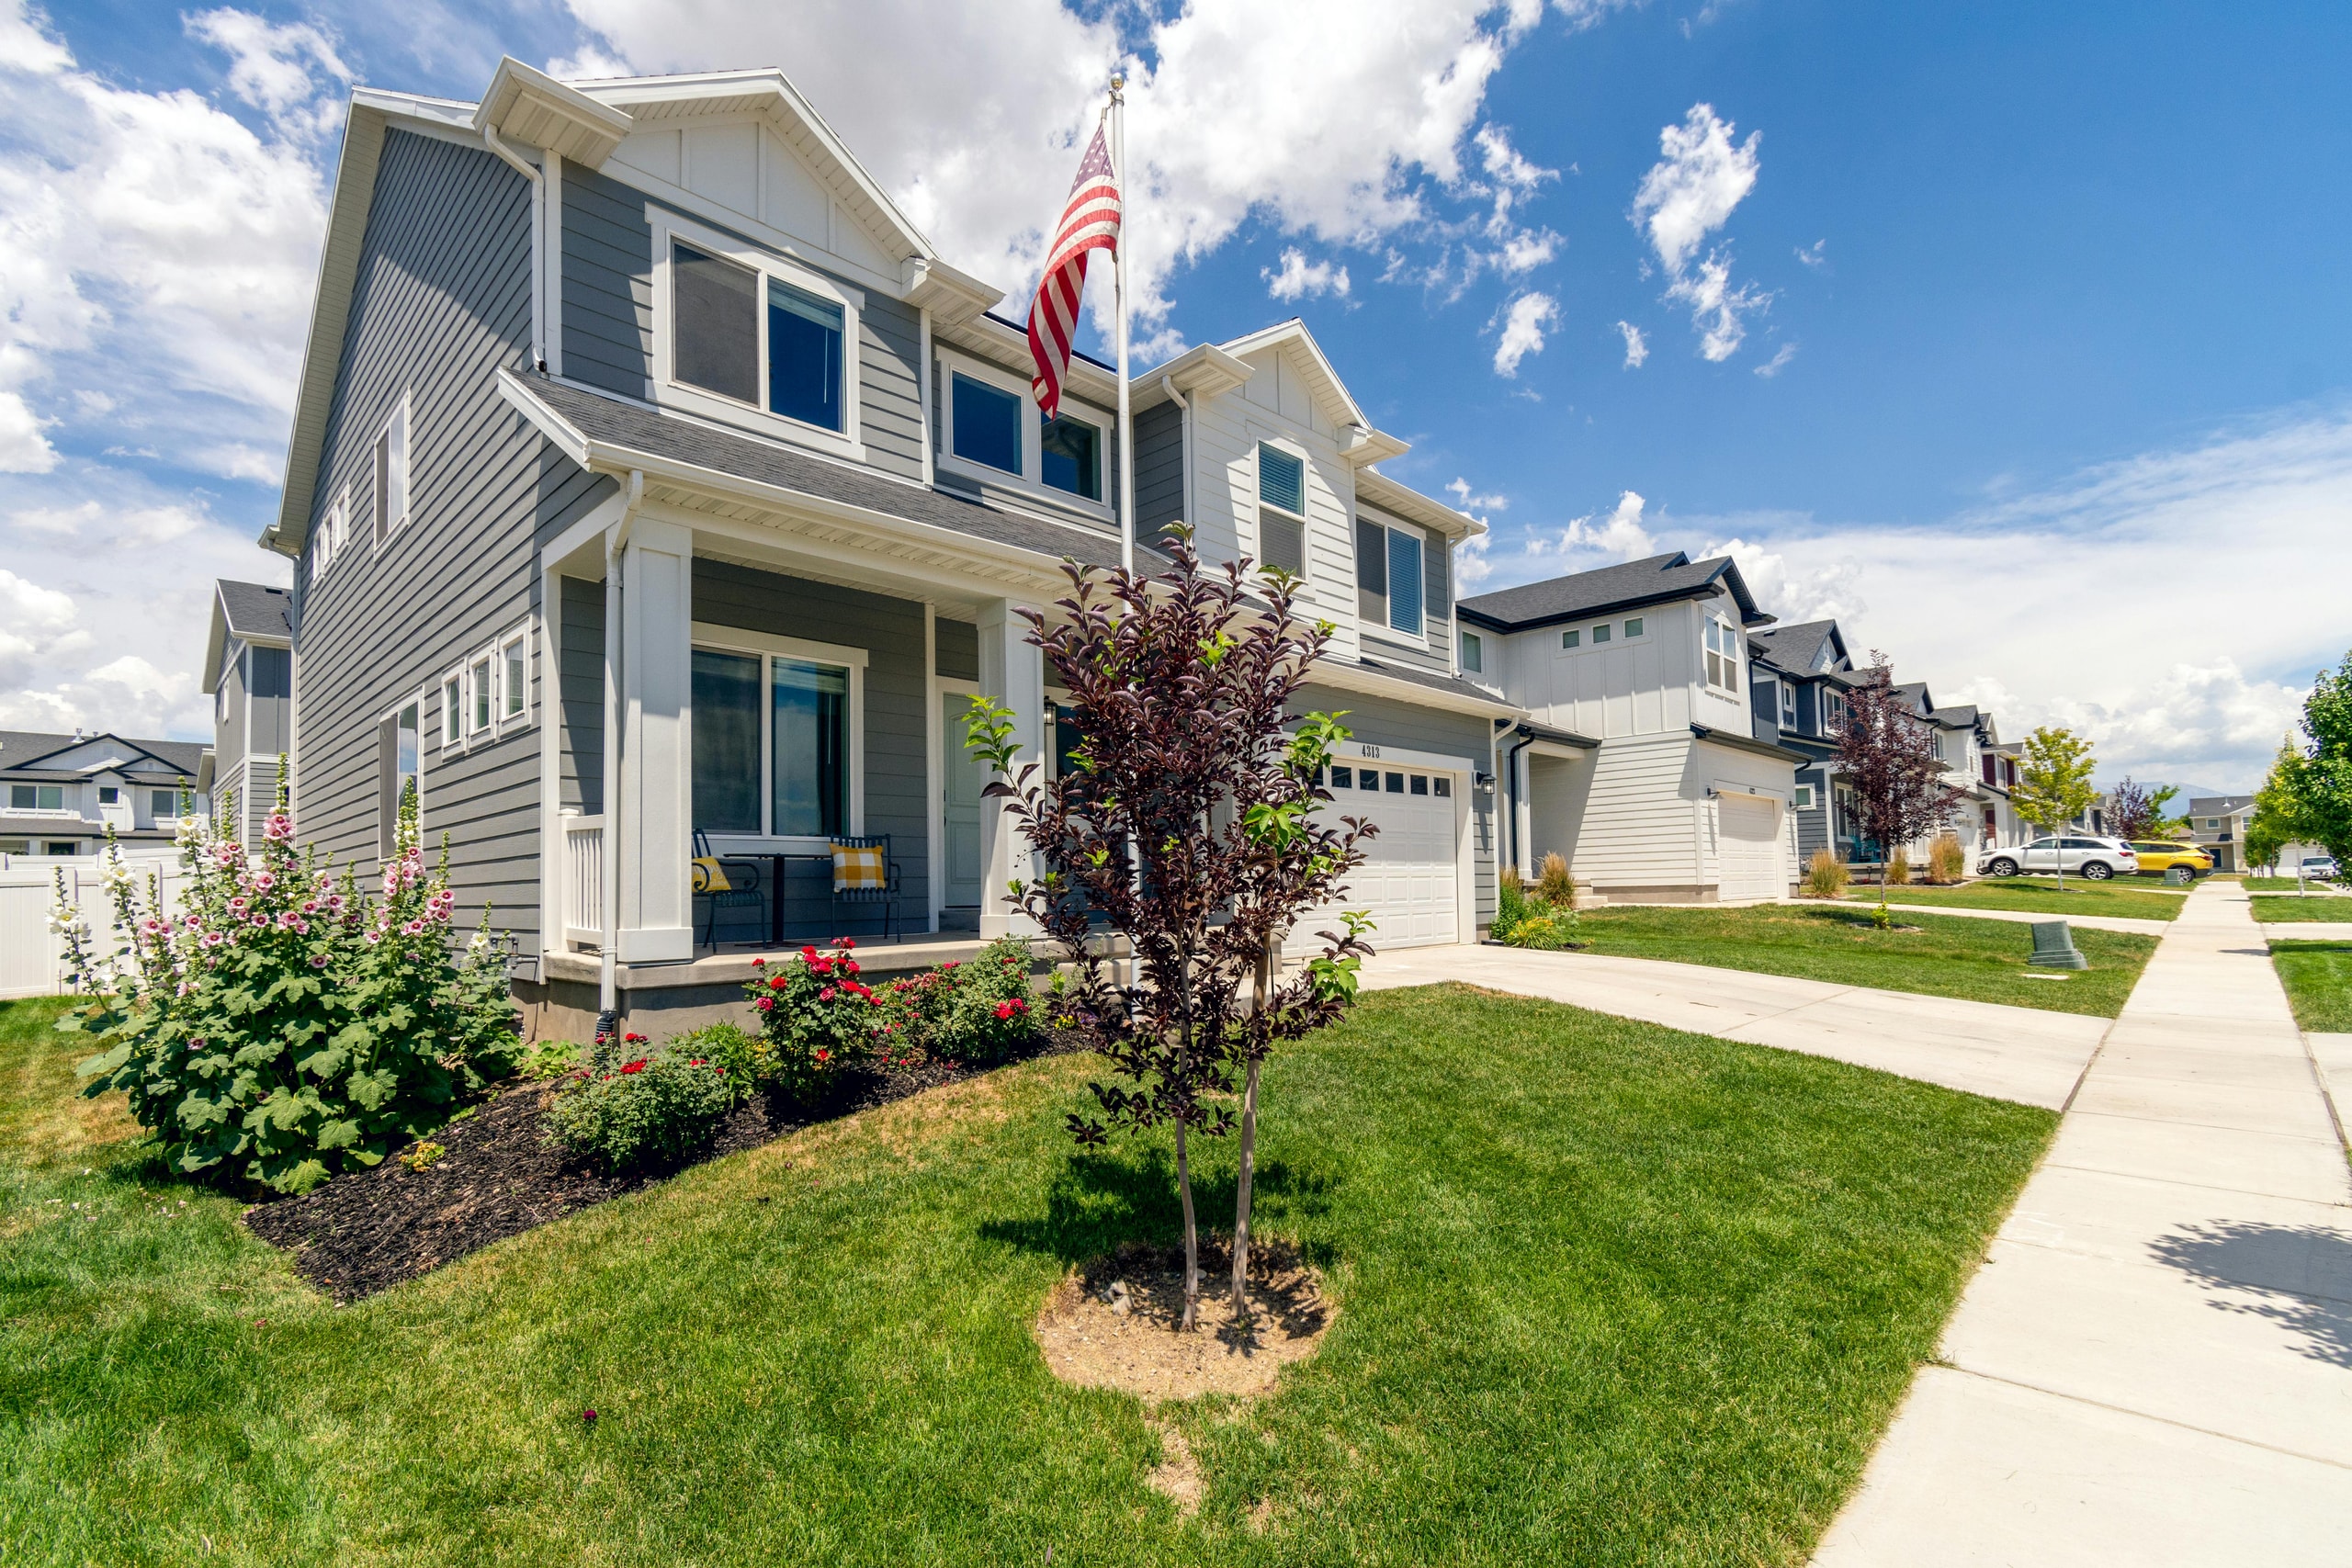
Suburban Sunset
Spacious multi-bedroom homes with lawns as a baseline norm.

The American Porch
The front porch: a uniquely American semi-public living space.

Suburban Autumn
Tree-lined suburban streets as a middle-class baseline.

Suburb in Spring
Green lawns and blossoms: the expected standard of home ownership.

Florida Suburbs
Sun Belt living: pools, palms, and year-round outdoor life.
Disposable Income & Charitable Giving
The United States consistently has the highest Household Net Adjusted Disposable Income in the OECD. More importantly, when measuring Actual Individual Consumption (AIC) — which details all goods and services actually consumed by households, including those funded by the state — the US stands alone.
Even the poorest US states have higher real consumption levels than major Western European countries like the UK, France, or Germany. This consumer power is matched by a culture of private charity: Americans voluntarily donate a massive percentage of their income to local causes and international aid, consistently ranking at the absolute top of the World Giving Index.
OECD Net Adjusted Disposable Income
American households lead the developed world in adjusted disposable income, leaving more room for savings, investing, and discretionary spending.
World Giving Index Supremacy
Despite narratives of European state welfare dominance, Americans are the most privately charitable people on Earth, preferring voluntary community support over state bureaucracy.
Healthcare Quality: Focus on Outcomes
The reflexive critique is that America 'spends more and gets less' — but this collapses when shifting from input spending metrics to actual treatment outcomes. For the diseases that claim lives in large numbers, the United States leads the developed world in 5-year survival rates.
Leading Cancer Survival Rates
Breast cancer, prostate cancer, colorectal cancer, and leukemia all show American patients outperforming their counterparts in single-payer European systems due to faster access to cutting-edge treatments.
Diagnostic Equipment Density
The US has more MRI and CT scanners per capita than virtually any other OECD nation. Conditions are caught earlier, and patients avoid the bureaucratic waiting queues common in state-managed European gateways.
Contextualizing Life Expectancy Stats
The oft-cited life expectancy gap is almost entirely explained by lifestyle factors — obesity, vehicular accidents, and violent crime — rather than the quality of medical delivery itself. When it comes to treatment, the quality of care remains unmatched.
CITIES OF AMERICA
Coast to coast — vibrant metropolises, state capitals, and thriving mid-size cities that define American urban life.

Pasadena, CA

Seattle, WA

Chicago, IL

New York, NY

Austin, TX

Dallas, TX

Seattle, WA

Nashville, TN

Savannah, GA

Seattle in Spring

Dallas — Aerial

Chicago — Aerial

Santa Monica, CA

Atlanta, GA
AMERICA FROM ABOVE
Cities at Altitude
From 1,000 feet up, America's great cities reveal their true scale — engineered grids of steel, glass, and water that pulse with the nation's economic and cultural energy.
The Ask America Oracle
Ask the AI Oracle about purchasing power parity, average home sizing, car ownership statistics, healthcare survival rates, or the democratization of luxury.
The Visual Record
Iconic Photographs
The postwar American dream — abundance, suburbia, and the everyday life that defined mid-century prosperity, captured on film.
Migrant Mother1936
Dorothea Lange's portrait for the Farm Security Administration became the defining image of the Great Depression and American documentary photography.
Nipomo, California
The Kitchen Debate1959
At the 1959 American National Exhibition in Moscow, Vice President Nixon and Khrushchev debated the merits of capitalism amid a model American kitchen.
Moscow, USSR
Aerial View of Levittown, New York1950s
Levittown's mass-produced houses made homeownership attainable for millions of postwar families and defined the American suburb.
Long Island, New York
The Suburban Backyard Barbecue1950s
The backyard barbecue became a ritual of postwar suburban leisure and the growing American middle class.
United States
A Family Gathered Around a Black-and-White Television Set1950s
Television swept into American living rooms in the 1950s, reshaping family life, news, and shared culture.
United States
Loading Up the Station Wagon for a Road Trip1960s
The wood-paneled station wagon, loaded for a family road trip, captured the mobility and leisure of postwar America.
United States
A 1950s Drive-In Movie Theater1950s
The drive-in theater married two American loves — cars and movies — into a defining leisure pastime of the 1950s.
United States
A Mid-Century Mother Using an Automatic Washing Machine1950s
Affordable automatic washers and other appliances dramatically cut domestic labor and reshaped American home life in the 1950s.
United States
Children Receiving the Salk Polio Vaccine1955
The 1955 national rollout of the Salk vaccine to schoolchildren ended the annual terror of polio epidemics across America.
United States
The First Sears Roebuck Catalog of the Post-War EraPost-war era
The Sears Roebuck catalog brought the full range of American consumer goods to every mailbox, a cornerstone of mid-century retail.
United States
A 1980s Family with their First Apple II or IBM PC1980s
Affordable machines like the Apple II and IBM PC brought computing into American homes in the 1980s, previewing the digital age.
United States
Standard of Living in the United States
The standard of living in the United States encompasses the average level of economic welfare, access to goods and services, health outcomes, and quality of life experienced by its population, characterized by one of the world's highest gross domestic product per capita on a purchasing power parity basis—approximately…